You, Me, and the "Second Screen"
Let’s talk Warriors. As the NBA Finals came to the final showdown between the Golden State Warriors and the Cleveland Cavaliers, the Warriors outsmarted, outplayed and ultimately took home the Larry O’Brien Championship Trophy. In the best of 7 series, the Warriors triumphed in game 6 with a 105 to 97 scoring battle. An exciting matchup, the Cleveland Cavaliers has only participated in one NBA Final (2007) with 0 championship wins, while the Golden State Warriors hadn’t won championship in since 1970, ending their ‘40 year drought’.
Throughout the series, point for point, there were showstopping, nail biting, hang time moments between Stephen Curry (League MVP), Andre Iguodala (Series MVP), LeBron James, and let’s not forget the game-changing slam dunk by Festus Ezeli.
The 2015 NBA finals witnessed a ratings jackpot averaging 19.9 million viewers per game, a 30% increase over last year. While NBA viewership on television has been inconsistent over the past several seasons, the climactic battle between these two teams drew the highest ratings for the NBA finals since legend Michael Jordan’s final season in 1998. While we saw a huge increase in fans watching the finals live, at a remote facility or on television, we also saw a consistent increase in fans flocking to social media.
"Facebook reported 32 million of its users were discussing the NBA Finals"
During the game 2 of the series, held at Oracle Arena (the home-court for the Warriors), you could catch glances of users checking their mobile phones at pivotal points in the game as it was being aired on national television. In fact, if you freeze frame at just the right time, you can catch a glance of NBA mega-star, Steph Curry, passing by his team’s bench where 4 fans out of 6 visible in the frame were looking down at their mobile phones, not at the magnetic pro-athlete passing by.
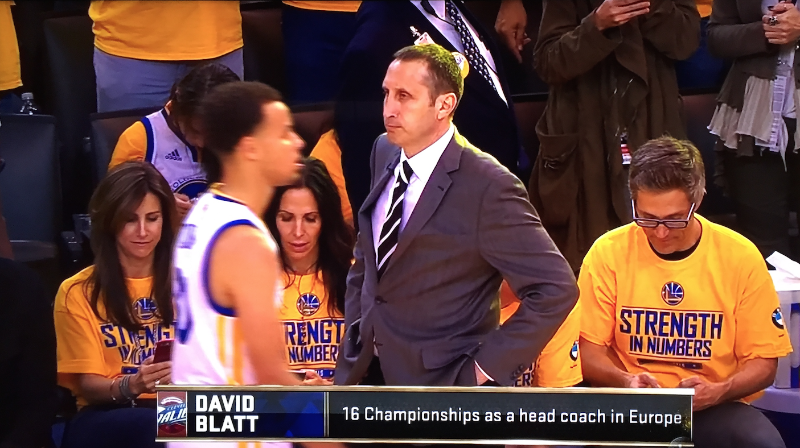
Game 2 @ Oracle Arena
This aligns with what we have come to know about fan engagement... that anytime there is a pause, timeout, or less action than normal during game time (let’s say a ‘free throw’), fans immediately go to other screens to look at the latest stats, check social media, or maybe even share a court-side photo. Fans are not only willing, but eager to take their eyes away from the main attraction and direct their focus to other forms of engagement: mobile phones, the jumbotron, or even a fan engagement wall.
"A reported 98 million video views were tied to the NBA Finals"
Mobile, interactive, and other digital signage experiences in stadiums and arenas is one of the areas that we know fans are becoming increasingly attracted to. Fans dive to these secondary screens to maintain the energy and buzz they are experiencing live, blast to their social networks, and stay in the loop across other channels, creating these “game-break digital moments”. As we continue to analyze pre, during, and post game metrics, operations, franchise managers, sports facilities etc. need to capitalize on these secondary screens throughout all touchpoints of the fan experience.
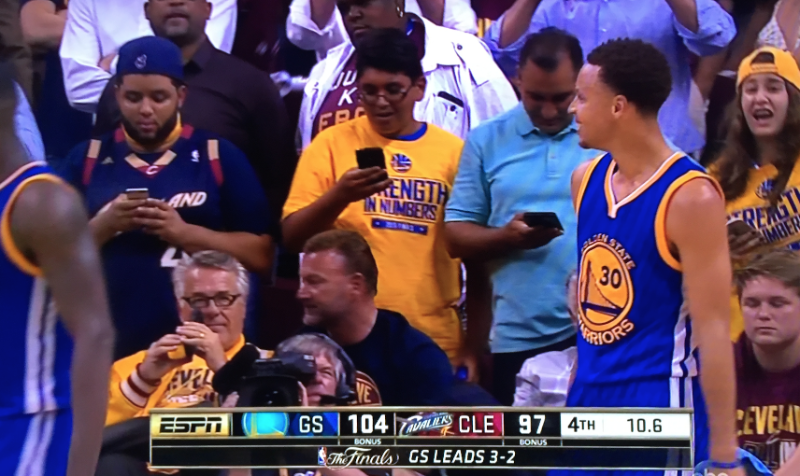
Game 6 @ Quicken Loans Arena
Take the average NBA game. Most games average 2 hours and 18 minutes in total run time. Let’s take this a step further… if you factor in 45 minutes prior to the game, where fans are congregating, finding their seats, waiting for tip-off, and another 15 minute post game as they file out of the stadium or meet-up with friends and family, you’re looking at a total of 3 hours and 18 minutes of highly potential fan engagement time. Working backwards (since the clock only runs when the ball is in play and we know there’s exactly 48 minutes of on-the-court play time) we subtract 48 minutes of “down-time” from 198 minutes of the total gameday, you’re looking at 2.5 hours of potential ‘fan engagement time’. Not all of these 2.5 hours is commercial time or dead-air, but it is inaction and we believe this wealth of “down-time” and inaction is being converted to these “game-break digital moments”. This leaves fans looking elsewhere, off the court, around the stadium, to their mobile devices, for potentially 2.5 hours where they can turn to these secondary screens for additional content, social, updates and other types of gameday action.
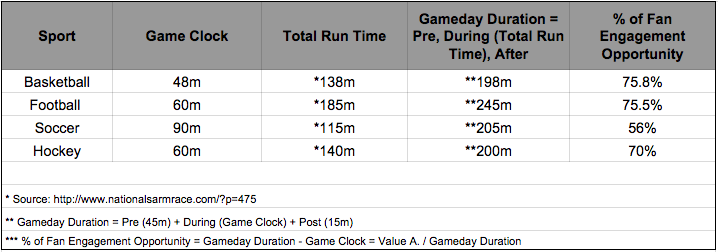
Chart above shows the large percentage of Fan Engagement Opportunity time available for each stadium/team to take advantage of.
"How do stadiums capitalize on this?"
These “game-break digital moments” are an opportunity for stadiums to engage with fans via mobile apps, digital signage and social media. To begin aligning your in-stadium experience with these moments, consider the following touchpoints as key components for building your Fan Engagement Journey Maps.
- Understand the Fan’s Perspective The fan engagement journey map needs to represent the different types of interactions your fan can have on gameday, as they would experience it. A simple process is to plot these interactions in the pre, during and post game phases. Each one of these phases lends itself to a variable type of fan behavior and a unique opportunity for engagement. Clearly identify the fan’s mindset at each phase and prescribe how can you customize the experience around their relative needs.
- Include Fan Goals Understanding your fan’s perspective at each phase of the gameday experience allows you to anticipate the goals they might be trying to achieve so that you can better help them meet and exceed those goals.
- Consider that Fans are Emotional All for the sake of their favorite player or hometown team, fans are emotionally invested in seeing their team’s do well, play hard, and ultimately win. Let’s digress again to the Warriors… and think of the fact that Oracle Arena was sold-out for the 6th game of the series when the Warriors had the opportunity to take home the championship. And that’s right… the game wasn’t even at Oracle Arena, but fans were excited, nervous, and hopeful as their team played their crucial away game, and eventually overwhelmed as the Warriors clinched their victory in a shower of confetti and tears as fans celebrated at the ‘empty-court’ Oracle Arena. Playing into these emotions is important for fan engagement as you will be able to play into the highs and lows during the fans gameday experience, allowing you to align your digital activities bringing the fan engagement journey to new levels.
- Chart your Touchpoints As you build the fan experience and begin charting out your fan engagement touchpoints in conjunction with the above steps, you will be able to see the key moments where emotions are high and the magic of fan engagement can happen. Be sure to include the ideal experience time per touchpoint so that you have a purposeful approach to each touchpoint.
- Seize Opportunities Communicate a clear value proposition for the fans and outline your objectives to align with what a fan is thinking, feeling and experiencing before the game, at the game, after the game, and the days that follow. These essentials need to coincide to be successful and create a win-win-win experience.
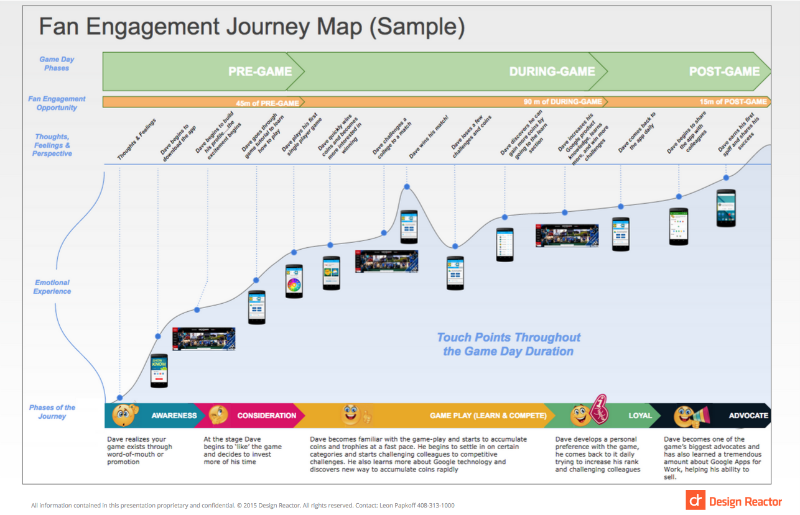
Chart above outlines a sample template for a Fan Engagement Journey Map.
"Two days after the Championship win, the Warriors are receiving 3,732 mentions/hour on Twitter"
The 5 steps outlined above are the building blocks of a successful fan engagement journey map. These building blocks lay the foundation for you to capitalize on this new phenomenon of “game-break digital moments” where during inactive, ‘down-time’ fans can engage with meaningful content that you’ve created just for them to enrich the gameday experience.